JEE Main 2025 — Solutions Question with Solution
JEE Main 2025 (2 Apr Shift 1)
Question
Which of the following graph correctly represents the plots of at 1 bar gases in water versus temperature?
Choose an option
Show full solutionCorrect option: D
Correct answer
D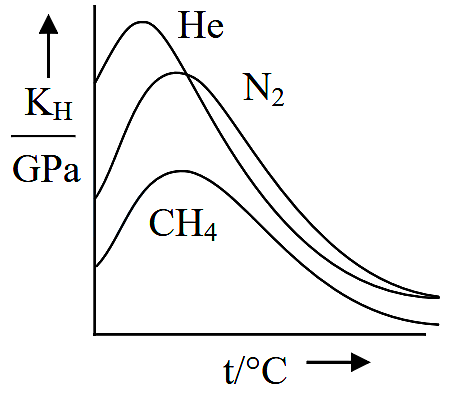
Step-by-step explanation
As temperature increases solubility first decrease then increase hence first increase than decrease also at moderate temperature value .
Practice this on the real CBT interface
Solve this JEE Main question (and the rest of the Solutions chapter) on PrepSharp's TCS iON-style CBT player — with timer, bookmarks and session analytics.
Solve interactively →About this question
This is a previous-year question from JEE Main 2025, covering the Solutions chapter of Chemistry. PrepSharp catalogues every PYQ from JEE Main with a verified answer key and step-by-step solution prepared by IIT alumni — so you can search by chapter, topic or year and revise efficiently.