JEE Main 2023 — Laws of Motion Question with Solution
JEE Main 2023 (30 Jan Shift 1)
Question
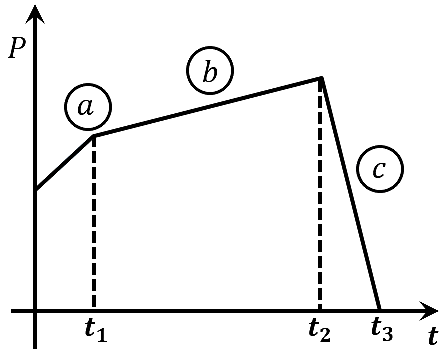
The figure represents the momentum time curve for a particle moving along an axis under the influence of the force. Identify the regions on the graph where the magnitude of the force is maximum and minimum respectively ?
If
Choose an option
Show full solutionCorrect option: C
Step-by-step explanation
From Newton's second,
From the given graph, we can see that slope of region is maximum and slope of region is minimum.
Thus, .
Practice this on the real CBT interface
Solve this JEE Main question (and the rest of the Laws of Motion chapter) on PrepSharp's TCS iON-style CBT player — with timer, bookmarks and session analytics.
Solve interactively →About this question
This is a previous-year question from JEE Main 2023, covering the Laws of Motion chapter of Physics. PrepSharp catalogues every PYQ from JEE Main with a verified answer key and step-by-step solution prepared by IIT alumni — so you can search by chapter, topic or year and revise efficiently.