JEE Main 2014 — Electromagnetic Induction Question with Solution
JEE Main 2014 (19 Apr Online)
Question
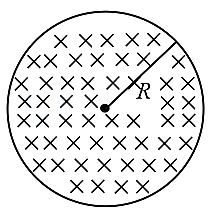
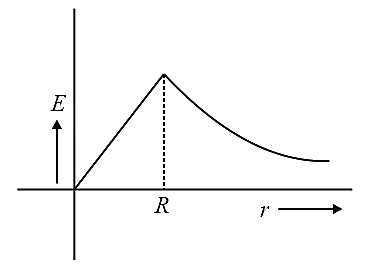
The figure shows a circular area of tthe radius where a uniform magnetic field is going into the plane of the paper and increasing in magnitude at a constant rate. In that case, which of the following graphs, drawn schematically, correctly shows the variation of the induced electric field ?
Choose an option
Show full solutionCorrect option: A
Step-by-step explanation
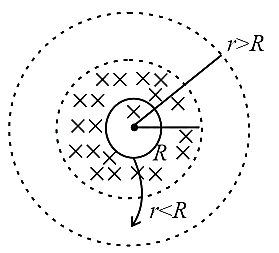
for
,
for
, 
Practice this on the real CBT interface
Solve this JEE Main question (and the rest of the Electromagnetic Induction chapter) on PrepSharp's TCS iON-style CBT player — with timer, bookmarks and session analytics.
Solve interactively →About this question
This is a previous-year question from JEE Main 2014, covering the Electromagnetic Induction chapter of Physics. PrepSharp catalogues every PYQ from JEE Main with a verified answer key and step-by-step solution prepared by IIT alumni — so you can search by chapter, topic or year and revise efficiently.