JEE Main 2023 — Center of Mass Momentum and Collision Question with Solution
JEE Main 2023 (01 Feb Shift 2)
Question
Figures (a), (b), (c) and (d) show variation of force with time.
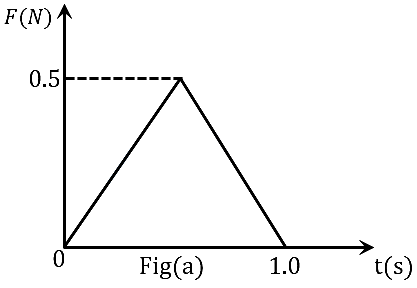
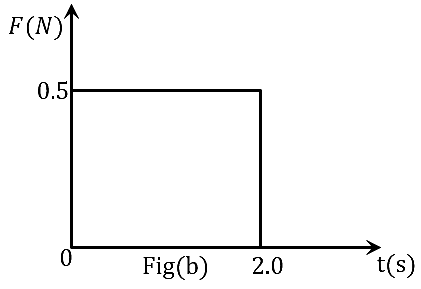
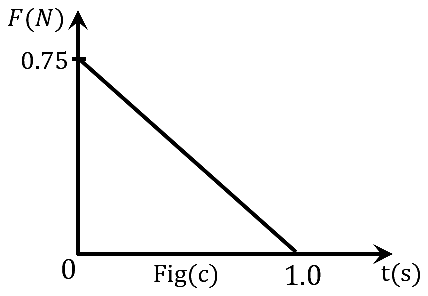
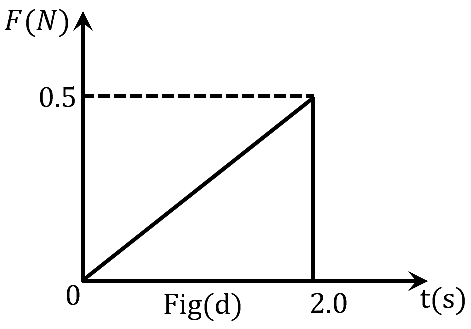
The impulse is highest in figure.
Choose an option
Show full solutionCorrect option: B
Step-by-step explanation
As we know, impulse is the area under the curve of the force vs. time graph. So, analysing each figure area under curve.
From above calculations, area under curve in figure (b) is maximum. Thus, fig (b) impulse is highest.
Practice this on the real CBT interface
Solve this JEE Main question (and the rest of the Center of Mass Momentum and Collision chapter) on PrepSharp's TCS iON-style CBT player — with timer, bookmarks and session analytics.
Solve interactively →About this question
This is a previous-year question from JEE Main 2023, covering the Center of Mass Momentum and Collision chapter of Physics. PrepSharp catalogues every PYQ from JEE Main with a verified answer key and step-by-step solution prepared by IIT alumni — so you can search by chapter, topic or year and revise efficiently.