JEE Main 2026 — Thermodynamics (C) Question with Solution
JEE Main 2026 (21 January Shift 1)
Question
Which of the following graphs between pressure ' p ' versus volume ' V ' represents the maximum work done?
Choose an option
Show full solutionCorrect option: A
Correct answer
A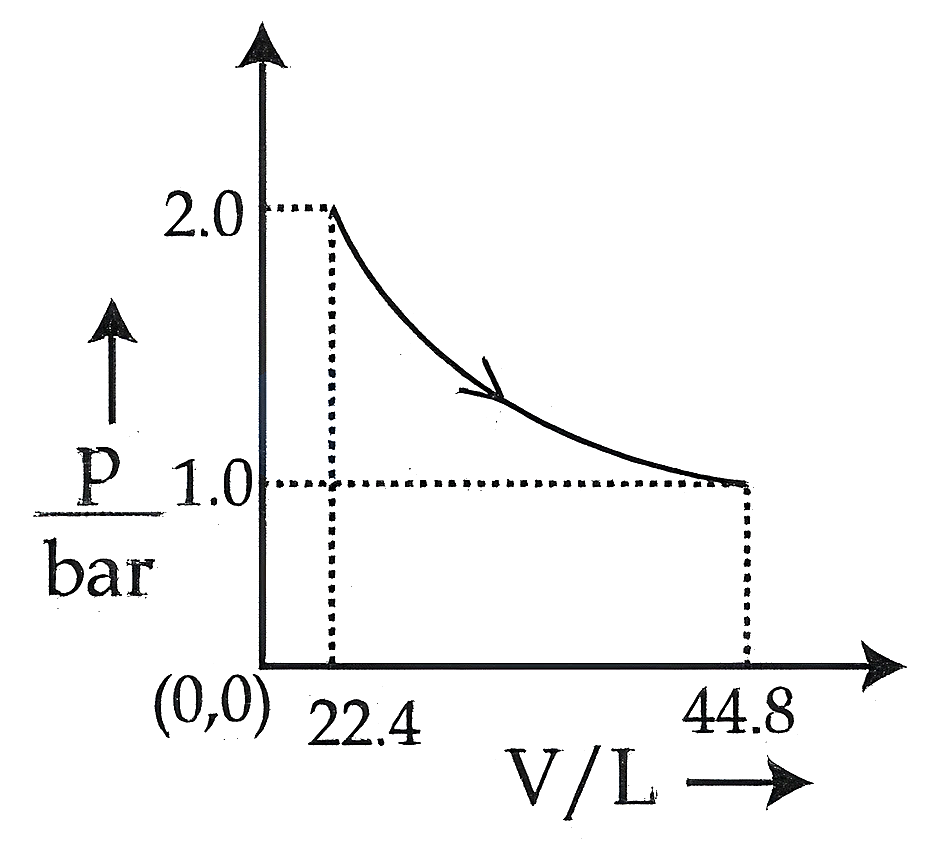
Step-by-step explanation
In a pressure-volume () graph, the magnitude of work done is represented by the area under the curve bounded by the volume axis.
Let's analyze the area under the curve for each graph:
Graph (1) represents an expansion from L to L. The area is the integral , which covers a significant region under the curve.
Graph (2) represents a cyclic process. The net work done is the area enclosed by the loop. This area is much smaller than the total area under the expansion curve in graph (1).
Graph (3) represents an isochoric process (constant volume L). Since , the work done .
Graph (4) also represents a cyclic process. Similar to graph (2), the net work done is the area enclosed by the loop, which is smaller than the area under the expansion curve in graph (1).
Comparing all cases, the expansion process in graph (1) covers the maximum area under the curve, thus representing the maximum work done.
Practice this on the real CBT interface
Solve this JEE Main question (and the rest of the Thermodynamics (C) chapter) on PrepSharp's TCS iON-style CBT player — with timer, bookmarks and session analytics.
Solve interactively →About this question
This is a previous-year question from JEE Main 2026, covering the Thermodynamics (C) chapter of Chemistry. PrepSharp catalogues every PYQ from JEE Main with a verified answer key and step-by-step solution prepared by IIT alumni — so you can search by chapter, topic or year and revise efficiently.