JEE Main 2021 — Chemical Kinetics Question with Solution
JEE Main 2021 (01 Sep Shift 2)
Question
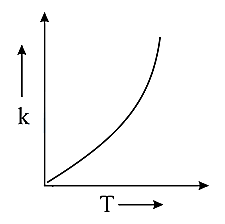
Which one of the following given graphs represents the variation of rate constant with temperature for an endothermic reaction?
Choose an option
Show full solutionCorrect option: D
Correct answer
D
Step-by-step explanation
Relation between rate constant (k) and absolute temperature (T):
Arrhenius equation:
The value of rate constant (k) will increase exponentially with rise in temperature for all type of reactions.
Practice this on the real CBT interface
Solve this JEE Main question (and the rest of the Chemical Kinetics chapter) on PrepSharp's TCS iON-style CBT player — with timer, bookmarks and session analytics.
Solve interactively →About this question
This is a previous-year question from JEE Main 2021, covering the Chemical Kinetics chapter of Chemistry. PrepSharp catalogues every PYQ from JEE Main with a verified answer key and step-by-step solution prepared by IIT alumni — so you can search by chapter, topic or year and revise efficiently.